
How to Control Part Weight Variation: A Process Fingerprint
Table of Contents
A 16 cavity connector tool shipped 240,000 housings across three weeks before incoming inspection flagged a 1.8 percent weight drift across the last two shipments. Three cavity positions ran 0.04 mm under nominal wall, and the reject claim covered 40,000 parts. The process sheet tracked only peak injection pressure, so the worn non-return valve behind the drift never appeared in the data. Part weight is the cheapest process meter on the floor, and it would have caught that shift 12 hours into the run rather than three weeks after it. This guide turns that single number into a working control loop.
The route runs from balance choice to a 30-shot baseline, then through the eight drift drivers, cavity pressure confirmation and the reaction limits.
The Snapshot
- A 1 mg balance on a 12.400 g part resolves 0.008 percent. One weighing takes 20 to 30 seconds, against 6 to 12 minutes for a CMM check across four dimensions.
- ±0.5 percent spread inside a 30-shot sample is the short-term target. On a 12.400 g part that band is ±0.062 g, while a 2 percent drift is a process shift, not scatter.
- Eight drivers explain almost every weight move. Switchover point, cushion stability, check ring wear, screw recovery, non-return valve leakage, melt viscosity, mold temperature and regrind ratio.
- Weight CpK is not dimension CpK. A weight index of 1.33 against a critical dimension index of 1.00 points at the tool, not at the press.
- Reaction limits at 0.75, 1.5 and 2.5 percent. Warning, action and quality hold, all measured from the baseline mean and reviewed every hour.
Why Part Weight Is the Cheapest Process Meter
Weight is the only single number that carries fill, packing, cooling, material density and tool geometry at once. Injection pressure shows what the screw did, while weight shows what the cavity received. When a process drifts, the part gets heavier or lighter within minutes, before any dimension leaves tolerance.
The economics are lopsided. An analytical balance costs a few thousand dollars and needs no fixture, no program and no temperature-controlled room. A CMM check across four features consumes 6 to 12 minutes of machine time on top of the inspection queue. At one weighing per cavity per hour on a 16 cavity tool, weight sampling costs an operator about 8 minutes across an 8 hour shift.
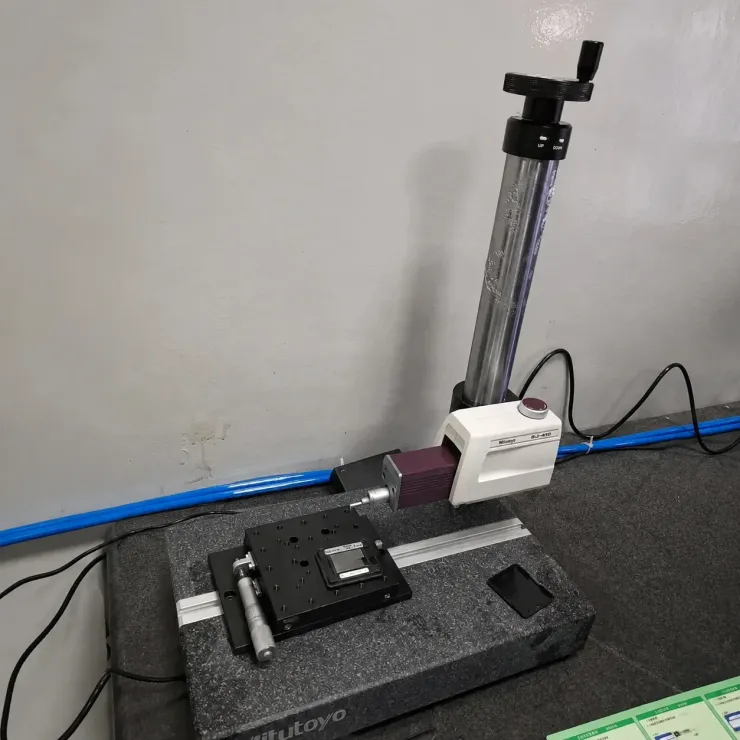
Match the balance to the part. A 0.1 mg balance covers parts under 1 g, where 10 mg of scatter would hide the whole control band. A 1 mg balance covers a 12.400 g housing and reads to 0.008 percent of part mass, sixty times finer than a ±0.5 percent band. The sensitivity of the part to process change decides whether the method works at all.
That sensitivity is measurable, and usually larger than expected. On an unfilled semi-crystalline part with a 2 mm wall, a 1 percent weight shift rides with a 0.3 to 0.6 percent shift in wall thickness, because both track the same specific volume. On a glass-filled grade the same weight shift may sit inside the compound density variation and move the wall by under 0.1 percent.
Weight also catches failures that dimensional checks are too slow to see. A short shot that still fills the cavity leaves a 0.5 to 2 percent light part with dimensions inside tolerance, and a short cushion packs the part harder for a 0.3 percent weight gain. Both appear in the first hour of a weight log and in no first article inspection.
The Weight to Dimension Correlation and Where It Breaks
Part weight and part dimension are two readings of the same physical event: the amount of material packed into a fixed cavity volume. While material density and cavity geometry stay constant, the two move together. That is what makes weight useful as a daily fingerprint and what makes it dangerous as a substitute for metrology.
The correlation holds best on unfilled, uniform-wall, semi-crystalline parts. A 1 percent weight gain on a polypropylene housing usually carries a 0.3 to 0.6 percent increase in wall thickness, because extra packing pressure reduces shrinkage. Keep the wall between 1.0 and 3.5 mm, keep the gate sealed, and the relationship stays stable enough to alarm on.
Three conditions break the link outright. The first is any foamed or gas-assisted process, where weight can fall 15 to 30 percent while the outer dimensions stay unchanged because the cavity is still packed with a cellular core. The second is a glass or mineral filled compound, where filler load shifts ±2 percent between lots and moves density by 0.01 to 0.02 g/cm³. The third is a thick wall above 4 mm, where a shrinkage void absorbs the extra material.

Three more conditions weaken it. A change in regrind ratio shifts fill pressure by 5 to 15 percent at the same shot weight. A molded-in insert buries the polymer signal, since a 30 g metal component inside a 40 g part ignores the process entirely. A part weighed too early reads high, because a hygroscopic grade such as PA66 picks up 0.1 to 0.3 percent moisture on a bench within an hour.
Use the two measurements for different jobs. Weight detects that something changed within minutes on a part that costs nothing to measure, while metrology accepts or rejects the part against the drawing. When the two disagree, run a density check by buoyancy to ±0.001 g/cm³ to separate a material change from a process change, and follow the cavity-level cases through how to fix dimensional instability.
Setting the Target Band: 0.5 Percent in a 30-Shot Sample
Build the baseline before anyone talks about capability. Run 30 consecutive shots on the production tool with production settings, and weigh every cavity separately on one balance. Let the parts reach 23 °C ±2 °C, or apply the same fixed delay to every part.
Thirty shots is enough to compute a mean and a standard deviation on each cavity, and short enough that the mold temperature and material lot stay constant across it. From that sample, the short-term spread target on a stable process is 0.5 percent of the mean weight, peak to peak within one cavity.
Run the measurement system check first, and run it on the real part. Weigh one part ten times in a row, and keep those ten readings inside ±0.002 g. Then run a gauge study on ten parts, two operators and two repeats, and hold combined reproducibility under 10 percent of the tolerance band you intend to police. A study that fails this step has no authority, because the balance is reporting its own variation.
| Part mass | Balance readability | Resolution at part mass | Handling rule |
|---|---|---|---|
| Under 1 g | 0.1 mg | 0.01 percent at 0.8 g | Draft shield and anti-static bar, tweezers only |
| 1 to 20 g | 1 mg | 0.008 percent at 12.4 g | Weigh after 23 °C ±2 °C condition or a fixed 20 minute delay |
| 20 to 200 g | 10 mg | 0.005 percent at 200 g | Closed draft shield, single operator for the whole study |
| 200 g to 2 kg | 0.1 g | 0.005 percent at 2 kg | Level platform, fan and vent air off during the reading |
← swipe to scroll →
Table note: readability bands assume a single part weighed at ambient with no runner attached. Confirm the balance calibration certificate and the repeatability figure before the baseline study starts.
Set the control limits from the baseline rather than from the drawing. Where the drawing carries no weight callout, use ±1.5 percent of the baseline mean as the working specification and ±0.5 percent as the short-term spread target. Tie both numbers to the critical dimension they were established with, because a weight band without a dimension reference cannot be explained to a customer later.
The Eight Drivers of Weight Variation
Every weight move on a running press traces back to a short list of mechanisms. Diagnosis is faster with a fixed list, because the shape of the drift points at two or three candidates before any hardware is touched.
- Switchover point. A 0.5 mm shift in the velocity to pressure transfer position moves part weight by 0.3 to 1.0 percent. Transfer belongs on screw position or cavity pressure, never on time, because a time-based transfer slides with viscosity.
- Cushion stability. Hold the cushion at 8 to 15 percent of shot size and stable within ±0.3 mm. A cushion creeping toward zero starves the packing phase and drops weight by 0.3 to 0.8 percent with no alarm on the machine screen.
- Check ring wear. A ring with 0.05 mm of radial wear leaks material back across the seat during injection. Part weight falls, screw forward time grows and cushion rises, all gradually across weeks.
- Screw recovery variation. Recovery time varying by more than 0.3 seconds inside one cycle leaves the shot at inconsistent density. Backpressure below 0.3 MPa is the usual cause, and the symptom is 0.5 to 1.5 percent scatter.
- Non-return valve leakage. A sudden 1 to 3 percent weight loss after a viscosity change points at the valve seat rather than at wear. Leakage scales with backflow pressure, so a thinner grade exposes a seat that held on the previous lot.
- Melt viscosity batch to batch. Melt flow rate commonly varies ±10 to 15 percent between lots of one grade. At a fixed velocity profile that becomes a 1 to 3 MPa injection pressure shift and a 0.5 to 1.5 percent weight shift.
- Mold temperature drift. A 10 °C rise on the cavity face thins the melt and increases shrinkage, moving weight by 0.8 to 1.5 percent. Most tools soak 3 to 6 °C in the first two hours, so the baseline needs a warm-up curve.
- Regrind ratio. Every 10 percent change in regrind content moves fill pressure and weight by 0.2 to 0.6 percent. A 25 percent blend drifting to 35 percent through a shift changes the part with no setting change at all.
Separate the drivers by how fast they move. Switchover, viscosity and regrind changes appear inside one shift, while check ring and tool wear take weeks. Mold temperature drift follows the thermal history of the run and repeats at the same hour of every shift once the pattern is plotted.
Mapping a Weight Pattern to a Cause
Weight data has three useful shapes. A trend walks slowly in one direction, an offset is one cavity sitting away from the group, and scatter is shot-to-shot noise without direction. Each shape eliminates most of the candidate list before a technician opens the press door.
| Weight pattern | Likely cause | Confirming measurement | Action |
|---|---|---|---|
| Rising 0.5 to 2 percent across 4 to 8 hours | Mold temperature rise or a lengthening hold time | Cavity thermocouple, cushion readout, cycle time log | Trim cooling flow, reset hold time, recheck cushion |
| Falling 0.5 to 2 percent across weeks | Check ring wear or a worn non-return valve seat | Screw forward time, cushion height, shot weight | Replace the valve tip and seat, then rerun the baseline |
| One cavity offset by 0.5 to 2 percent | Hot runner tip, gate wear or a choked cooling circuit | Per-cavity weight map, thermography on the cavity face | Inspect the drop, clean the circuit, verify gate size |
| Scatter of 0.5 to 1.5 percent with no trend | Regrind blend variation or low backpressure | Lot records, recovery time spread across 20 shots | Fix the blend ratio, raise backpressure to 0.5 to 1.0 MPa |
| Step change at a shift or lot boundary | Transfer method change or a different melt viscosity | Injection pressure at constant velocity, material certificate | Standardize transfer, verify the lot before running |
| Heavier part with a longer cycle | Gate not sealed, so hold pressure packs past the gate | Gate seal study against hold time, part weight curve | Extend hold time until weight plateaus, then lock it |
← swipe to scroll →
Table note: the shapes and causes listed are typical patterns from production weight logs. Confirm the cause with the measurement in column three before changing a setting or ordering a part.
Log the weight with the parameters that could explain it. Record cushion, transfer position, fill time, peak injection pressure, cavity temperature and material lot beside the number. A weight trend without those six fields costs an hour of digging every time, while a trend with them usually explains itself on the page.
Cavity Pressure and Short-Shot Confirmation
Weight tells you that the process moved. Cavity pressure tells you where in the cycle it moved, which is the difference between a two hour fix and a two day investigation. One pressure sensor at the last point to fill, read through the cycle, covers both jobs.
Peak cavity pressure for an engineering grade typically lands between 20 and 50 MPa, against 600 to 1,500 bar of injection pressure at the nozzle. Loss between nozzle and cavity runs 30 to 50 percent depending on runner size and gate design, which is why nozzle pressure is a poor control signal. A 1 percent change in part weight usually appears as a 1.5 to 3 percent change in peak cavity pressure.
Use the sensor for transfer and for confirmation. Set the velocity to pressure switchover at a pressure level on the last fill point rather than at a screw position, and the process stops reacting to lot-to-lot viscosity. Then read the same trace after any weight correction to confirm the correction did what the settings assumed. Part weight scales with the pressure time integral, and that same peak sets the clamp force, as covered in how to calculate clamp tonnage.
The short-shot study is the cheapest map of fill volume to weight. Start at 90 percent of the transfer stroke and increase fill in 2 percent steps, weighing the full shot at each step. Weight rises linearly until the cavity is full, then the curve flattens as extra material goes into packing. The knee is complete fill, and on a 12 g part a 95 percent fill volume delivers about 97 percent of full weight.
The gate seal study uses the same logic in the time domain. Hold pressure from 1 second to 8 seconds in 1 second steps, weigh each set, and stop when weight stops rising. A 1.5 mm gate usually seals in 3 to 5 seconds, and extra hold beyond that point adds cycle time with no quality benefit.
CpK on Weight Versus CpK on the Critical Dimension
Capability indices need a specification before a number means anything. Drawings rarely carry a weight callout, so weight capability runs against a working specification of ±1.5 percent of the baseline mean, written into the study rather than assumed. Without that line on the page, a weight CpK is an opinion.
Report weight and dimension side by side, because the pair explains the cause. A weight index of 1.33 next to a critical dimension index of 1.00 says the press fills and packs consistently while the tool lets the part move, which points at cooling layout, shrink compensation or gate position. The reverse pair says the press or the material supply needs attention instead.
| Metric | Cost per check | Sample basis | What it proves | Working band |
|---|---|---|---|---|
| Part weight | 20 to 30 seconds | 30 shots per cavity | Repeatability of fill and packing | Under 0.5 percent spread |
| Critical dimension | 6 to 12 minutes on a CMM | 30 parts for a PPAP study | Conformance to the drawing datum scheme | CpK 1.33 minimum, 1.67 for tier-1 |
| Peak cavity pressure | Continuous, inside the cycle | Every shot | Stability of the packing phase | ±2 percent of the baseline peak |
| Shot weight with runner | 20 to 30 seconds | Hourly | Machine repeatability before degating | ±0.3 percent |
← swipe to scroll →
Table note: bands are working targets from production capability work, not drawing requirements. Set the final limits from your own baseline and record the sample size beside every index reported.
Weight capability needs 30 weighed parts per cavity, which on a 16 cavity tool means 480 weighings and three hours of bench time. Most plants start with the pooled cavity mean and add a per-cavity index on the two or three cavities carrying the tightest wall. A scientific molding study builds that data set in a fixed sequence and sets the process window the limits are drawn from.
Sampling Frequency, Charts and Reaction Limits
Sampling frequency follows the tool rather than the operator's spare time. On a 16 cavity tool, weigh every cavity on the first three shots once the process stabilizes at 30 minutes, then rotate five cavities per hour so the full set is covered every three hours. Weigh the full set again at each shift change and after every material lot change.
Chart the readings as individual and moving range values per cavity, or as an X-bar and R chart with five parts per check. Draw the limits from the baseline study and review the chart at the press, because a chart filled in after the run is history rather than control.
Three reaction limits keep the response proportionate. A 0.75 percent move from the baseline mean is a warning: log it, check cushion and cavity temperature, and sample again within the hour. A 1.5 percent move on one cavity, or 1.0 percent on the all cavity mean, is an action limit: resample 10 shots, then correct transfer or hold time. A 2.5 percent move is a quality hold: quarantine parts back to the last good check by shot count. Seven consecutive points on one side of the mean, or two of three points beyond two standard deviations, call for the same response as an action limit.
Handing Weight Data to the Customer as Evidence
Customers rarely ask for weight data by name. They ask for evidence that the process is stable, and weight is the fastest way to assemble that file. A usable package holds the 30 shot baseline per cavity with mean and standard deviation, the control chart across the run, the per-cavity weight map, cavity pressure traces from the start and end of the run, short-shot and gate seal curves, the material lot record, and the balance calibration certificate.
State the measurement uncertainty on the page, because it decides how much of the band the data can prove. A 0.002 g repeatability on a 12.400 g part is 0.016 percent, about one thirtieth of a ±0.5 percent band. Pair the weight file with a first article inspection report on the drawing dimensions and keep both for the 12 month record period that IATF 16949 expects. Never present a weight index as dimensional capability, because a customer who finds that substitution stops trusting the rest of the file.
Part Weight Variation FAQ
Q1. What weight tolerance should a molding process hold?
±0.5 percent spread within a 30 shot sample on a stable process, against a working specification of ±1.5 percent of the baseline mean across a full day. A tighter band than that turns the balance and the weighing routine into the limiting factor.
Q2. Why does part weight rise during a shift?
Mold temperature, most often. A cavity face that soaks 3 to 6 °C in the first two hours drives weight up by 0.8 to 1.5 percent. Check cavity temperature and cushion before adjusting the transfer position.
Q3. Can part weight replace a dimensional measurement?
No. Weight is a drift alarm that detects change within minutes, while dimension is an acceptance measurement against the drawing. On foamed, glass-filled and thick-wall parts the two signals separate completely.
Q4. How often should parts be weighed?
Every cavity at start-up and at shift change, then five cavities per hour on a large tool. One weighing per cavity per hour costs about 8 minutes of operator time in an 8 hour shift.
The Bottom Line
Weight control rests on four numbers: a balance that resolves 0.01 percent of part mass, a 30 shot baseline per cavity, a ±0.5 percent short-term spread target, and reaction limits at 0.75, 1.5 and 2.5 percent. Add cavity pressure to separate the packing phase from the filling phase, and drift diagnosis stops being guesswork.
The order of work matters. Prove the measurement routine first, because a balance with unverified repeatability produces data that cannot be defended. Build the baseline on a warm, stable mold, then hold the reaction limits on the floor and record every weight beside the cushion, transfer position and material lot. Weight is not a substitute for metrology, and it stays the only floor signal that reports a process shift within minutes.
DieStrike builds injection molds and stamping dies to IATF 16949 with ±0.005 mm mold accuracy and ±0.002 mm on EDM and jig-grinding. Cavity heat treatment runs to HRC 62 max, the shop runs 120+ machines, and it serves tier-1 programs for TE, Amphenol, Luxshare and Dongshan. Standard components ship in 3 to 7 days and complete tools in 2 to 5 weeks. Steady weight at the press starts with the tool that holds the cavity, so cooling, gate and shrink decisions belong on the injection mold manufacturing side of the job, with DFM feedback in 24 hours.
KEEP READING
Related Reading
How to Write a First Article Inspection Report
Ballooned drawing, measured values, disposition and the paperwork a tier-1 program expects at first-off.
Read articleArticleInjection Mold Validation: IQ, OQ and PQ
What each qualification stage proves, how many shots it takes and which records survive an audit.
Read articleArticleHow to Read a CMM Report
Datums, alignment, feature reporting and the difference between a true position result and a best fit.
Read articleServiceInjection Mold Manufacturing
IATF 16949 tool building with ±0.005 mm mold accuracy, DFM feedback in 24 hours and 2 to 5 week lead times.
Read articleNEXT STEP
Ready to Start Your Mold?
Send us your element dimensions or part numbers — our team responds within 24 hours with pricing and lead time.

Written by
Ray ChanMold Buyer's Guide Author · Precision Mold Manufacturing Specialist. Ray helps global importers, distributors and OEMs source factory-direct molds and mold parts.