
How to Run a Scientific Molding Study: The Six Studies
Table of Contents
A 32-cavity connector tool was released on a recipe copied from a similar job. Parts met print for the first 500 shots. Eight weeks later a resin batch arrived 12 percent higher in melt viscosity, and 4 cavities short-shot while 11 flashed at 0.06 mm. The line produced 1,800 good parts in one week against a 14,000 part schedule. The study that would have prevented it takes three days of press time.
A scientific molding study is a set of six structured experiments that map how one press, one tool and one resin behave together. It replaces a locked recipe with a process window: a range of fill speeds, pressures and temperatures that still produces a conforming part. The output is data, not a settings sheet.
These six studies are the process half of a mold trial, which also carries T0, T1 and first article approval. This guide covers the six studies in the order they are run. It covers the instrumentation they need, the window widths worth accepting, the report a buyer should receive, and how the study feeds a PPAP submission. All figures are typical published or industry values, and each one needs checking against the press, the sensor certificate and the resin datasheet before a process goes on a control plan.
The Snapshot
- Six studies, 2 to 3 days of press time. Viscosity curve, injection speed, cavity balance, pressure drop, gate freeze and cooling time, run in that order on a 16 to 32 cavity tool.
- Cavity pressure at 0.1 percent repeatability. Sensors rated 0 to 200 MPa, calibrated to 1 percent of full scale and sampled at 1 kHz or faster. Only direct cavity pressure sees what the part sees.
- A window wider than the process noise. A fill time window of 20 to 30 percent around the setpoint and a hold pressure window of at least 15 percent. A 5 percent window fails within a month.
- Capability follows the study. Run 30 to 50 shots per cell inside the window, then 100 or more consecutive parts for the capability run. A Cpk of 1.33 needs a centered mean and a window that holds.
Why a Recipe Fails and a Window Holds
A recipe is a snapshot of one machine, one tool and one resin lot. Copy it to a second press with a worn check ring, and the same 1.6 second fill time delivers a different cavity pressure. The part does not respond to settings. It responds to fill rate, pressure at the gate and temperature at the moment of freeze.
That is why a study starts with the material rather than with the machine. A viscosity curve holds melt temperature constant and shows how fill pressure changes with fill time, from a shear-thinning plateau into a steep rise. Once the plateau is located, the molder has a defensible speed range instead of a copied number.
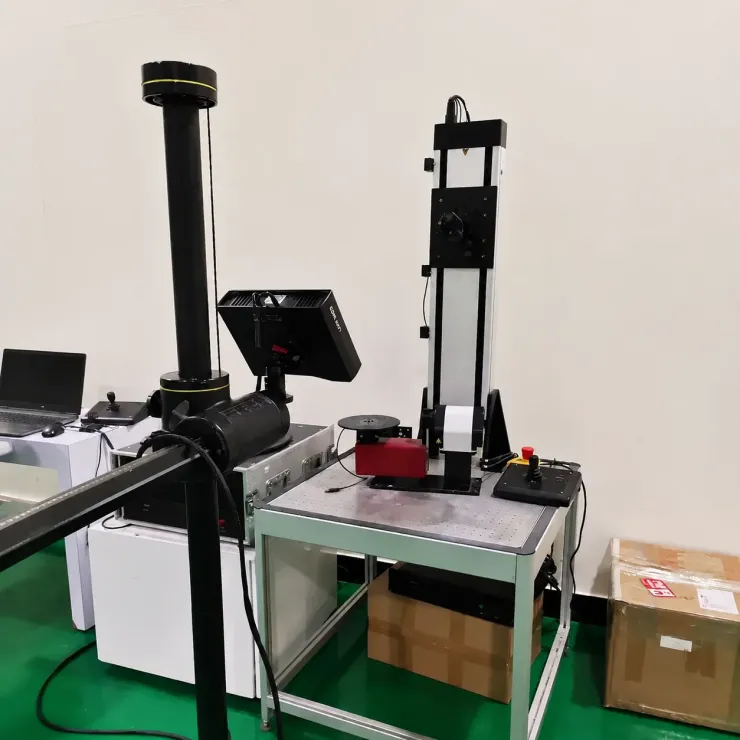
The window is the deliverable. A process that runs at exactly 1.6 seconds of fill with a 0.05 second tolerance is a coincidence, not a process. A study measures how far each variable can move before a critical dimension, a short shot or a flash line appears, then leaves 30 to 50 percent of that range as margin.
Cost is the second reason. A window that survives a resin lot change is cheaper than a study that does not exist. Rework typically runs 3 to 5 times the cost of the original feature once steel is cut. A drifted process that scraps 2 percent of a 400,000 part order wastes 8,000 parts before anyone notices the trend.
The Six Studies in Order
The six studies run in a fixed sequence, because each one fixes a variable that the next one needs stable. Run them out of order and the pressure drop result is noise.
| Study | Question it answers | Instrument and record | Practical pass criterion |
|---|---|---|---|
| 1. Viscosity curve | Where does fill pressure flatten out? | Nozzle or hydraulic pressure across 8 to 10 fill times | Plateau flatter than 3 MPa across a 3x fill time range |
| 2. Injection speed | How fast can the cavity fill without jetting or burning? | Fill time and peak pressure at 5 to 8 speed steps | Fill window of 20 to 30 percent either side of setpoint |
| 3. Cavity balance | Do all cavities fill in the same window? | Short shot series per cavity, or one sensor per cavity | Cavity to cavity fill imbalance under 5 percent |
| 4. Pressure drop | Where is pressure lost between nozzle and cavity? | Nozzle and cavity pressure on the same cycle | Drop repeatable within 5 percent over 20 cycles |
| 5. Gate freeze | How long does the gate stay open for packing? | Cavity pressure curve against hold time | Packing time at 80 to 90 percent of gate seal time |
| 6. Cooling time | When does the part stop shrinking? | Part weight over a cooling time series | Weight change under 0.1 percent between two steps |
← swipe to scroll →
Table note: pass criteria are typical industry targets for a 16 to 32 cavity tool running on a 50 to 250 tonne press. Confirm each one against the part print and the resin datasheet before it is written into a control plan.
Order matters more than depth. A viscosity curve across 10 fill times takes about 40 minutes and removes the largest single unknown in the process. That single curve also decides whether the tool can run at all at the target cycle, because fill pressure at the plateau tells you the machine size the job really needs.
Every study reports in machine-independent units: fill velocity in mm/s, cavity pressure in MPa, melt temperature in °C, shot weight in grams. Percentages of a screw stroke and timer values are useful on one press only, and they do not belong in a report that a second plant has to reproduce.
Studies 1 and 2: Viscosity Curve and Injection Speed
A viscosity curve holds melt temperature fixed and pushes fill time through 8 to 10 steps, from 0.3 seconds to 5 seconds. Record peak injection pressure at each step, then plot pressure against fill time. The curve falls steeply at short fill times, flattens, and rises again if the fill gets too slow and the melt starts to freeze off.
Here is a typical unfilled polypropylene at 230 °C. Peak pressure runs 95 MPa at 0.4 seconds, 68 MPa at 1.0 second and 52 MPa at 2.0 seconds. The curve then flattens into a 50 to 53 MPa band out to 3.5 seconds. The plateau is where fill time belongs. Filling on the steep side means a 0.1 second variation in the transfer point changes pressure by 4 to 6 MPa.
Study 2 takes the plateau and asks how fast the cavity will accept material. Step injection speed through 5 to 8 values and watch for jetting, silver streaking and burn marks at the last fill point. Set the transfer from velocity to pressure at 95 to 98 percent fill, so packing starts on a full cavity rather than on a partial one.
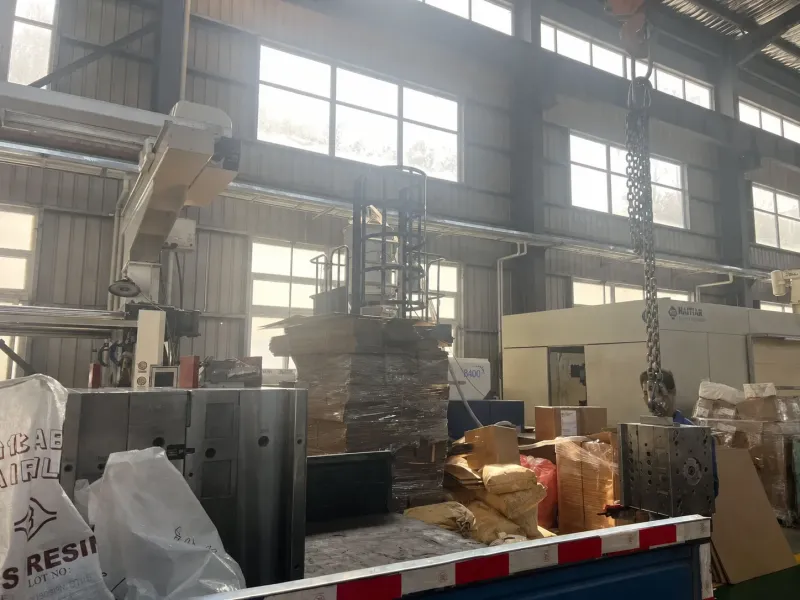
The pass criterion for both studies is a fill window of 20 to 30 percent either side of the chosen setpoint. If the part only fills at 1.55 to 1.65 seconds, the window is 6 percent and the job will drift. Widen it by adjusting wall thickness at the gate, gate size or melt temperature, and re-run the curve before blaming the press.
Study 3: Cavity Balance Across the Tool
Cavity balance asks whether every cavity fills in the same window. Two methods work. A short shot series weighs each part at a deliberately low fill of 85 to 90 percent. A sensor in every cavity reads the fill pressure directly, which is better but costs more.
On a 32-cavity tool, short shot weights commonly spread 0.05 to 0.15 g around a 1.2 g part. That is a 4 to 12 percent imbalance, and it means the last cavity to fill needs a higher pressure, a longer time or a hotter melt than the fastest one. The target is under 5 percent across the set, and under 3 percent on a tool that will run a tight dimensional tolerance.

Correction is mechanical, not parametric. The usual fixes are a gate land change of 0.1 to 0.3 mm on the fast cavities. An artificial runner balance step or a 5 to 15 °C tip temperature split on a hot runner also works. Turning up the injection speed hides the imbalance and pushes the flash risk onto the fastest cavity, which is the wrong trade.
Compare the measured result with the simulation before changing steel. A mold flow analysis reports predicted shear stress and fill imbalance per cavity, and it flags the same fast and slow cavities within about 5 percent of the trial result. If the two disagree, the difference is usually gate diameter in the simulation against the as-built tool.
Studies 4 and 5: Pressure Drop and Gate Freeze
Pressure drop is the difference between the pressure at the nozzle and the pressure inside the cavity on the same cycle. Record both at 1 kHz and read the peak of each curve. A typical 2 mm wall part shows 60 MPa at the nozzle and 38 to 45 MPa in the cavity. That is a 25 to 30 percent loss across the sprue, runner and gate.
The number matters because it defines the machine. If the drop is 30 percent at a comfortable fill rate, the press can hold the process through a warm afternoon. If the drop is 45 percent, there is no reserve and the cavity pressure will sag as soon as the melt viscosity rises by 10 percent on a new lot.
An unstable drop is a filler or seating fault. Across 20 cycles the drop should repeat within 5 percent. A drift of 8 percent or more points to a non-return valve leak, a cold slug, or a nozzle that is not seating on the sprue bushing.
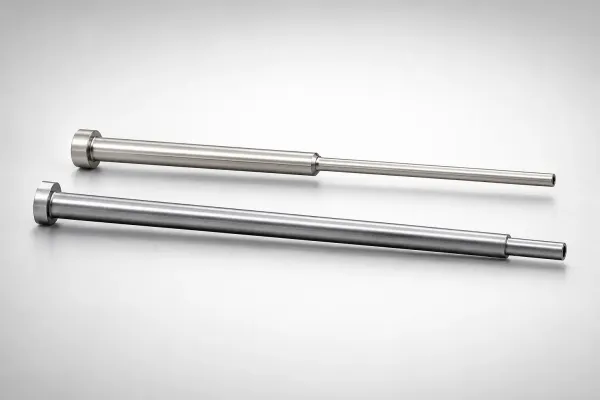
Study 5 is the gate freeze study, and it decides hold time. Step hold time from 1 second to 15 seconds in 1 second steps while watching cavity pressure. While the gate is open, the cavity pressure curve follows hold pressure. Once the gate seals, the cavity curve stops responding and the part weight plateaus.
Read the seal point and then set packing at 80 to 90 percent of it. On a 2 mm wall part in a 60 °C tool, gate seal usually lands at 3 to 6 seconds. Packing past the seal point adds 0.3 to 0.8 percent to part weight for no benefit, and it drives warpage and gate blush. Packing short of it leaves voids and a weight range that swings 0.5 to 2 percent.
Study 6: Cooling Time and the Part Weight Curve
The last study fixes cooling time with a part weight curve. Hold every other variable constant and step cooling time in 1 second increments, weighing five consecutive parts at each step. Part weight falls as cooling time rises, because a part ejected hot loses more mass and springs back less.
The curve flattens. When two consecutive cooling steps differ by less than 0.1 percent in weight, the part has stopped shrinking in the tool and further cooling only buys cycle time. A 2 mm polypropylene wall at a 40 °C mold face typically reaches that point at 12 to 16 seconds. A 3 mm wall reaches it at 20 to 26 seconds.
Cutting cooling time below the plateau costs more than seconds. A part ejected at 0.3 percent above its stable weight will continue to shrink on the bench and pull its dimensions short. On a 40 mm span, that reads as a 0.04 to 0.06 mm dimension shift measured 24 hours later, which is often the whole tolerance band.
Link the cooling result to ejection. Ejector pin marks, warpage over a long rib and a part that sticks in one cavity point the same way. Cooling time was set by the cycle goal rather than by the weight curve. Record the plateau, the measured weight at each step and the shot count at each step in the trial file.
Instrumentation: Sensor Accuracy and Placement
A study is only as good as its instrumentation. Cavity pressure sensors for this work typically carry a 0 to 200 MPa range, a repeatability of 0.1 percent of full scale, and a calibration tolerance of 1 percent of full scale. The data logger must sample at 1 kHz or faster, because the fill event on a 1.5 second shot is over in less than a second.
Direct cavity pressure is the only signal that describes the part. Hydraulic pressure describes the oil, and it lags the cavity during fill and pack. Place sensors where decisions are made: one at the end of fill in the last cavity, one near the gate of the first cavity, and one in the middle of the set.
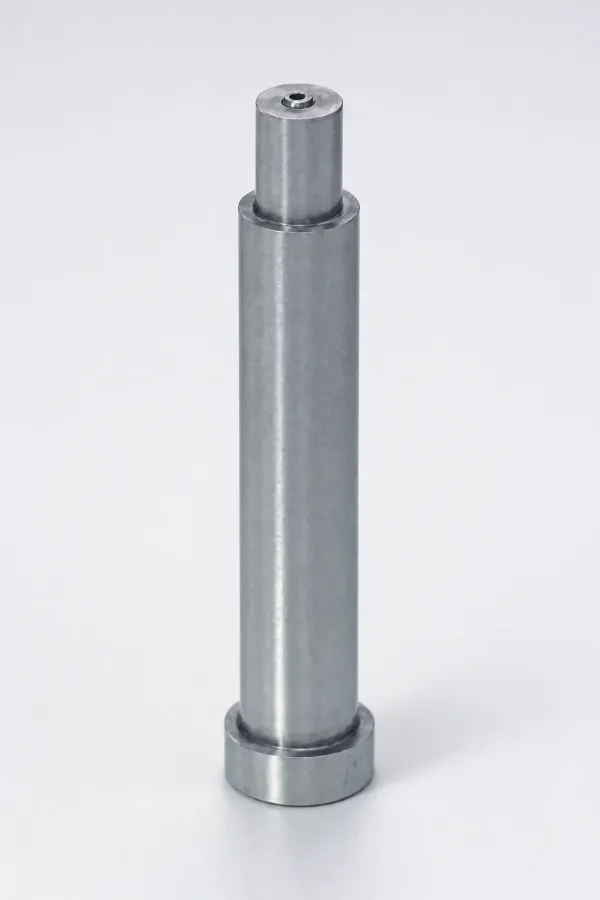
Add three more channels. A nozzle pressure sensor gives the drop calculation. A melt temperature probe at the nozzle reports the real injection temperature, typically 5 to 15 °C above the barrel setpoint after shear. A mold surface probe at six or more points verifies the cavity face is within 3 °C of setpoint before any data is used.
Keep the records. A study report should carry the sensor serial numbers, the calibration certificates with dates, the logger settings and the raw curves. Summary tables without the curves cannot be audited, and an IATF 16949 audit will ask for the link between the measurement and the decision.
Separating Variables: DOF and Decoupled Molding
A study fails when two variables move at once. If fill speed and hold pressure both change between two shots, the dimensional result cannot be attributed to either. That is the whole argument for one-factor-at-a-time studies on the fill stage, and for design of experiments only after the window is known.
The practical rule is to fix the fill before touching pack, and fix pack before touching cooling. Melt temperature stays constant through both, held within 1 °C at the nozzle. Mold temperature stays within 3 °C across the cavity face, verified with a probe rather than with a controller display.
Degrees of freedom describes how much the process can be tuned before it is overfitted. A well-instrumented tool with a stable check ring and a balanced runner gives the molder four or five real variables: fill velocity, transfer position, hold pressure, hold time and cooling time. A tool with an unbalanced runner and a leaking non-return valve gives two, and both of them are compensations.
Decoupled molding separates the stages so each one can be optimized alone. Stage one fills the cavity at a controlled velocity to 95 to 98 percent of volume. Stage two switches to pressure control and packs through the gate while it is open. Stage three holds a lower pressure while the part cools and stops moving. Each stage has its own data trace and its own pass criterion.
The evidence for decoupling is in the cavity pressure curve. A coupled process shows a single peak with the hold pressure folded into the fill peak. A decoupled process shows a clean fill peak at the transfer, then a separate, flatter pack plateau. The second shape repeats shot to shot within 2 percent, and that repeatability is what the capability run later measures.
Window Width Targets and Robustness Checks
A window is the range of one variable that still produces a conforming part. Measure it at the edges of the six studies and write it down as a number, not as an adjective. Target a fill time window of 20 to 30 percent around the setpoint, and a hold pressure window of at least 15 percent.
Hold time needs the most margin of any variable, because it is the one most often trimmed for cycle. If gate seal sits at 5 seconds and the process runs its hold at 4.5 seconds, the job has a 10 percent margin and a cold mold will under-pack it. Run hold at 80 to 90 percent of seal time instead, and accept the extra second.
Mold temperature is the variable buyers underestimate. A 5 °C rise in cavity temperature changes shrink by roughly 0.1 to 0.2 percent on a semi-crystalline resin. On a 40 mm dimension that is a 0.04 to 0.08 mm move, so a window written around a 60 °C setpoint with a 10 °C allowance is not a window at all.
Then run a robustness check. Deliberately move two variables to the edge of the window and run 20 shots. If the parts stay in print, the window is real. If they fail, the window was measured on a single good day and needs to be narrowed before it goes into the control plan.
Time is a robustness variable too. Run the check after a two hour warm-up, at the start of the second shift and after a 30 minute stoppage. A window that only holds on a warm tool is a maintenance finding, not a process finding.
The Study Report a Buyer Should Receive
A study that is not documented did not happen. The report is the deliverable a buyer pays for, and it should be readable by an engineer who was not in the room. Ask for eleven items, and treat a missing one as an open question rather than a formality.
- The six curves themselves: viscosity, injection speed, cavity balance, pressure drop, gate freeze and part weight against cooling time.
- The chosen setpoints with the measured window around each one, in machine-independent units.
- Sensor serial numbers, calibration dates and the sampling rate used for each channel.
- The short shot series with per-cavity weights and the balance percentage across the set.
- The cavity pressure curve at the production setting, overlaid with an upper and a lower window limit.
- Mold surface temperatures at six or more points, before and after the study.
- Melt temperature at the nozzle, measured and not read from the controller.
- Cycle time broken into fill, pack, cool, plasticize and mold open, with the seal time marked.
- The shot count and the resin lot number used for the study.
- A list of the variables changed, with the reason for each change.
- A clear statement of which variables are still open and what would close them.
Put the dimensional evidence beside it. A process study proves the process, and a CMM report proves the part. Ask for the CMM report on the cavities used in the study, checked against the same datum scheme that the drawing calls out, so the two documents describe the same object.
Keep the raw data files. Curves exported as images cannot be re-analyzed when a dimension drifts six months later. The ability to re-read an old trace often separates a two day fix from a two week argument.
From Study to PPAP and Capability Runs
The study feeds the PPAP submission, and the sequence is fixed. The study establishes the window, the capability run proves the process holds inside it, and the PPAP documents both. Skipping the study and running capability on a copied recipe produces numbers that do not survive the next resin lot.
The capability run follows standard rules: 100 or more consecutive parts, taken after the process has been running stable for at least one hour, with no adjustment during the run. Measure the critical dimensions on every part, then report Cp and Cpk against the drawing limits. A Cpk of 1.33 is the common automotive minimum, and 1.67 is common on safety related characteristics.
Capability is a statement about the window, not about the press. A Cpk of 1.33 with a 25 percent window is a process that can be handed to another plant. A Cpk of 1.33 with an 8 percent window is a lucky month, and the next audit sample will show it.
A PPAP submission built this way carries the study report, the capability data, the measurement system analysis and the control plan. The control plan then names the variables the study identified as critical, with their window limits, so production knows what must be monitored and what may be adjusted.
Plan the press time before the tool is built. A 2 to 3 day study slot plus a 1 day capability run is 3 to 4 days of machine time, and it is cheaper than a rework loop. On a 32-cavity connector tool, one week of scrap at 2 percent of a 400,000 part order is 8,000 parts, which usually costs more than the whole trial window.
Scientific Molding Study FAQ
Q1. How long does a scientific molding study take?
Two to three days of press time for the six studies on a 16 to 32 cavity tool, plus one day for the capability run. The viscosity curve alone takes about 40 minutes. The gate freeze and cooling time studies are the slowest, because they run 12 to 15 steps each at a full cycle.
Q2. Which study should run first?
The viscosity curve, always. It fixes melt temperature and fill time, and every later study depends on those two being stable. A cavity balance result taken before the viscosity curve is an artifact of a fill rate that nobody has chosen yet.
Q3. Do I need cavity pressure sensors to run a study?
Not strictly, but the study loses its teeth without them. Short shot weights, part weight and dimensional data can carry a study on a simple part. Any part with a tight tolerance, a cosmetic surface or a two stage pack needs direct cavity pressure at 0.1 percent repeatability to separate the fill stage from the pack stage.
Q4. What window width is good enough?
A fill time window of 20 to 30 percent around the setpoint and a hold pressure window of at least 15 percent. Hold time is set at 80 to 90 percent of measured gate seal time. Narrower than that and the process drifts between resin lots, wider than that usually means the tool is overbuilt for the part.
Q5. How does the study connect to PPAP?
The study sets the window, the capability run proves the process holds inside it, and the PPAP submission carries both plus the measurement system analysis and the control plan. Without a study, the capability numbers come from a process nobody can reproduce at a second plant.
The Bottom Line
A scientific molding study is six experiments run in a fixed order, with cavity pressure at 0.1 percent repeatability as the primary signal. It costs 3 to 4 days of press time and it replaces a copied recipe with a measured window.
Five numbers are worth carrying into any program. Six studies, a fill window of 20 to 30 percent and hold time at 80 to 90 percent of gate seal. Then cavity balance under 5 percent and a capability run of 100 or more parts against a Cpk of 1.33. Miss the study and those numbers are guesses. Hold them and the process survives a resin lot change, a press move and an audit.
DieStrike builds precision injection molds and dies to IATF 16949. Mold accuracy is ±0.005 mm, and ±0.002 mm on EDM and jig grinding. Cavity steel runs through HRC 62 across 120+ machines including EDM, jig grinding, CMM and five axis milling. Standard mold components ship in 3 to 7 days and complete tools run 2 to 5 weeks, with tier one references including TE, Amphenol, Luxshare and Dongshan. If you need a tool that can be studied rather than guessed at, send the part data and the tolerance callouts and we will return a DFM report and a trial plan.
KEEP READING
Related Reading
How to Read a CMM Report: GD&T, Datums and Capability
The dimensional evidence that has to sit next to a process study, from datum callouts to the Cpk column a buyer signs on.
Read articleArticleHow to Run a Mold Design Review: 12 Checks Before Steel
The freeze gate that happens before the press time, and the 8 documents that make a study possible at all.
Read articleArticleShrinkage Compensation Rules for Molds
Why 0.1 percent of shrink moves a 40 mm dimension by 0.04 mm, and how a cooling time study locks it down.
Read articleServiceMold Trial and T1 Sampling
Press time, instrumented trials and dimensional sampling on 120+ machines, with IATF 16949 documentation from the first shot.
Read articleNEXT STEP
Ready to Start Your Mold?
Send us your element dimensions or part numbers — our team responds within 24 hours with pricing and lead time.

Written by
Ray ChanMold Buyer's Guide Author · Precision Mold Manufacturing Specialist. Ray helps global importers, distributors and OEMs source factory-direct molds and mold parts.